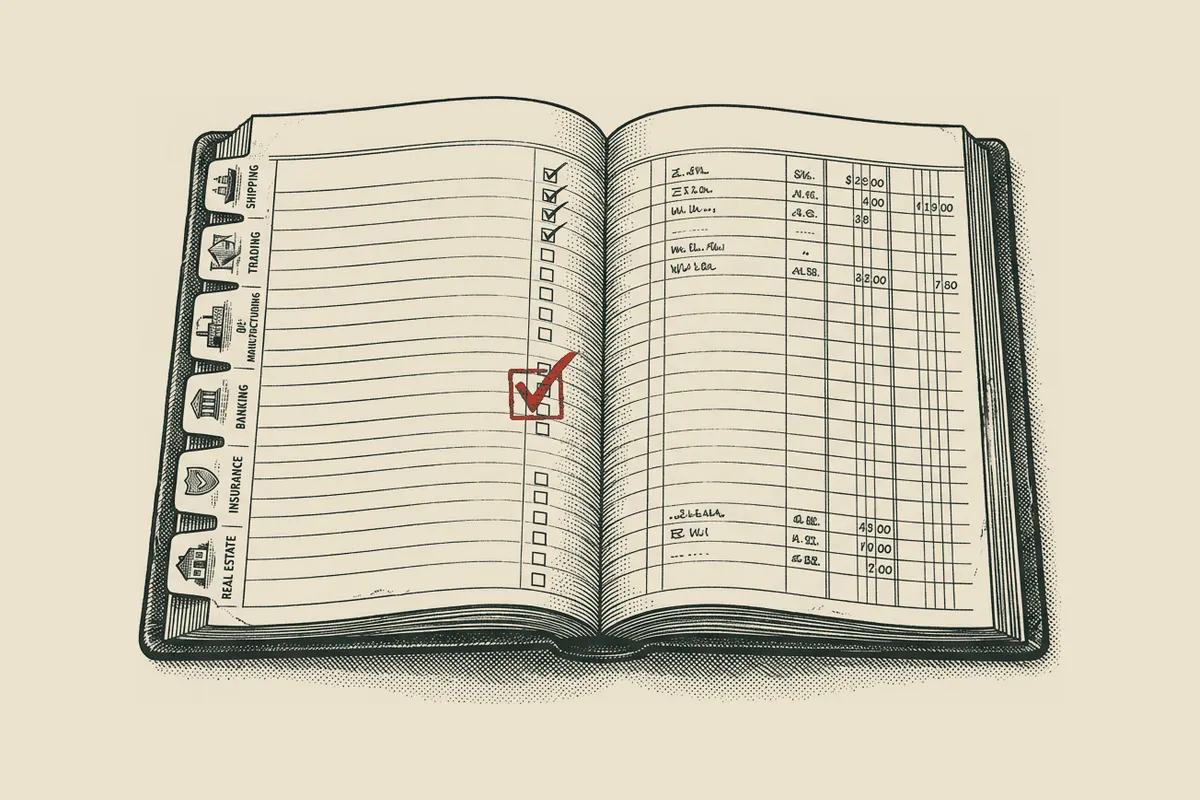
How to Build an AI Inventory by Line of Business for NAIC Exhibit A
Map your insurance AI systems by line of business for NAIC Exhibit A. Use this template to capture underwriting, pricing, claims, fraud, and customer service AI.
For Compliance officers, CROs, GCs, and business-line owners at insurers preparing for an NAIC AI examination.
Read if You need an Exhibit A inventory that business lines can actually fill out, not a spreadsheet that sits with IT.
When a market conduct examiner sends Exhibit A, the request looks simple enough: count the AI systems the company uses, sorted by operational area. But no single person knows the whole picture. Underwriting owns its models, claims has its triage tools, marketing licenses a lead-scoring platform, and customer service rolled out a chatbot. IT may have a list of servers, but that is not the inventory Exhibit A wants.
The real task is a business-line map of where AI influences insurance decisions. It is the base every other exhibit stands on, because you cannot show governance over systems you have not identified, detail high-risk models you never flagged, or trace data lineage you never recorded. The work starts with an honest list.
What Exhibit A is asking for
Exhibit A is first in the NAIC AI Systems Evaluation Tool because it is the foundation. Regulators use it to decide whether a company’s AI use is so limited or low-risk that further inquiry is unnecessary, or whether the examiner should proceed to Exhibits B through D. The question is not how advanced the models are; it is where AI influences decisions in the company 1. For a map of how the four exhibits connect, see the NAIC AI Evaluation Tool breakdown.
The tool defines an AI system broadly, as a machine-based system that can generate predictions, recommendations, content, or other outputs that influence decisions, operating with varying levels of autonomy from supportive to augmented to automated 1. That definition is intentionally wide. It catches the vendor feature embedded in a claims workflow, the underwriting model built by a third-party data provider, and the internal tool the data science team forgot to mention. If it influences an insurance decision with some degree of autonomy, it belongs in the inventory.
Exhibit A asks for a quantitative count by operational area. For each area, the carrier reports the number of AI systems in use and answers whether those systems directly affect consumers, carry material financial impact, were implemented in the last 12 months, and what the specific use cases are 1. Those four questions determine which systems become high-risk in Exhibit B, which get detailed in Exhibit C, and which data sources must be documented in Exhibit D.
Why organize by line of business, not by model
The natural instinct is to sort by model name, vendor, or technology stack. Regulators want the operational area and the decision, not the vendor or the model stack. The same vendor platform can serve both low-risk marketing scoring and high-risk underwriting. Two internal models built on the same codebase can sit in different risk buckets if one ranks work queues and the other recommends claim denials.
Organizing by business line also solves the ownership problem. The NAIC Model Bulletin expects a written AI Systems Program with accountability across business units, actuarial, data science, underwriting, claims, compliance, and legal 2. That program is the governance layer behind the inventory; for a practical breakdown of what it requires, see AI governance in insurance. When the inventory is owned by business lines, the people who can answer follow-up questions are already attached to each entry. When it is owned by IT, the examiner’s follow-up questions about consumer impact get routed through three departments before anyone can answer.
Assign each operational area a business owner and a compliance contact before filling in the systems. The owner knows what the system does. The compliance contact knows whether it has been tested, documented, and reviewed.
The 15 operational areas and how to group them
Exhibit A lists 15 operational areas, all in scope and grouped into five familiar clusters to make the inventory manageable.
| Cluster | Operational Areas | Typical Owner |
|---|---|---|
| Customer acquisition | Marketing; premium quotes and discounts | Marketing or distribution lead |
| Underwriting and pricing | Underwriting and eligibility; ratemaking and rate classification | Chief underwriter or chief actuary |
| Claims and service | Claims and adjudication; customer service; fraud, waste, and abuse | Claims operations lead |
| Health utilization | Utilization management and prior authorization | Health plan operations lead |
| Back office and support | Investment and capital management; legal and compliance; producer services; reserves and valuations; catastrophe triage; reinsurance | COO, CFO, or GC depending on area |
This clustering is a practical way to route each entry to someone who can answer for it, not a requirement of the tool. The examiner will still see the 15 operational areas in the exhibit format, but the internal worksheet should be organized so business owners can fill out their sections without becoming experts on the whole company.
Three areas deserve extra attention because they are often undercounted. Producer services includes AI tools used to route leads, score agents, or recommend which producers handle which accounts. Catastrophe triage includes models that rank claims after a hurricane or wildfire. Reinsurance includes treaty pricing models and ceding decisions. These are not fringe cases; they are areas where AI is used heavily and documented lightly. They are also the areas where the business-line risk map, described in AI use cases in insurance by business line, tends to expose gaps.
What to collect for each system
A usable inventory needs more than a count. For each AI system, the business owner should be able to answer a short set of questions. These fields map directly to Exhibit A and set up the work for the later exhibits.
- Operational area. Which of the 15 categories does it fall under?
- System name and version. What is the system called internally? If it is a vendor platform, what module or feature is being used?
- Function. What output does it produce: a score, a recommendation, a classification, a triage decision, or generated content?
- Decision context. Does it influence a consumer-facing decision, an internal workflow, or both?
- Direct consumer impact. Does the output affect coverage, eligibility, pricing, claim payment, or communication to a consumer? This field often moves a system into the high-risk column.
- Material financial impact. Does the system affect reserves, pricing, reinsurance, or capital allocation? If so, it matters even if it does not touch the consumer directly.
- Autonomy level. Is it supportive, augmented, or automated? A system that recommends but requires human action differs from one that executes without review.
- Implementation date. Was it deployed in the last 12 months? Newer systems often lack testing and monitoring records.
- Owner and data steward. Who is accountable for the model, and who can explain where its data comes from?
- Vendor or third-party flag. Was the system developed internally or acquired from a vendor? If vendor, who has contractual audit rights?
- Last validation or review date. When was the model last tested for accuracy, drift, or disparate impact?
Most fields can be answered in a single sentence. The hard part is finding the person who knows the answer.
The four questions that drive risk
Exhibit A asks four questions that shape the rest of the exam. Treat them as risk gates.
Does the system directly affect consumers? If yes, the system is likely high-risk. Coverage, pricing, eligibility, claims settlement, and prior authorization all fall here. Even a system that only recommends can have a direct effect if the human reviewer rarely overrides it.
Does the system have material financial impact? This captures systems that do not touch consumers directly but matter to the company’s financial condition. Catastrophe triage, reinsurance pricing, and reserve models are examples. They may not trigger consumer-protection scrutiny, but they can trigger financial-condition scrutiny.
Was it implemented in the last 12 months? Newer systems are more likely to lack documentation, validation records, and drift monitoring. The examiner will look for evidence that the system was tested before deployment, not just that it was deployed.
What is the specific use case? This is where vague labels hurt. “Fraud detection” is not enough. “Flags property claims for special investigation” is better. “Flags property claims in certain ZIP codes for special investigation” is better still, because it surfaces the data inputs and potential disparate impact that Exhibit D will ask about.
Where carriers usually go wrong
The most common failure is gaps in what the company thinks it knows, not dishonesty.
Shadow AI. Business lines adopt tools without telling compliance. A marketing team licenses an AI copywriting platform. A claims manager starts using an AI assistant to summarize notes. These tools influence work and sometimes decisions, but they never appear on an IT inventory. The fix is to ask business owners a broader question: not what AI models they have, but what software uses automation or predictions to help them decide.
Vendor-operated systems. A carrier may use a vendor platform that includes AI features it does not fully understand. The NAIC Model Bulletin makes clear that insurers are responsible for AI systems whether they developed them or acquired them from a third party, and that due diligence and audit rights stay with the insurer 2. If the vendor cannot explain how a feature works, that gap is the carrier’s problem in the exam.
Model versus system. A model is a statistical artifact. A system is what operates in production. Exhibit A asks about systems. A carrier with three underwriting models but one production platform should list the platform once and note the models it contains. A carrier with one model used in three different workflows should list three systems, because the consumer impact and risk profile differ by use.
What to start doing this week
You do not need perfect software to build a good Exhibit A inventory. You need a clear process and owners who cannot pass the question to someone else.
First, schedule a 30-minute session with each business-line leader. Give them the 15 operational areas and ask them to name every system that produces predictions, recommendations, classifications, or automated outputs. Do not ask for models. Ask for systems that influence decisions.
Second, route each identified system through the ten fields above. For systems where the owner cannot answer, mark the gap and assign a due date. An incomplete inventory with visible gaps is far more useful than an inventory that looks complete but is missing whole categories.
Third, flag third-party systems and systems implemented in the last 12 months. These will be the examiner’s first follow-up targets. Make sure someone has the vendor contracts and can locate the audit rights clause.
Finally, accept that the first version will be incomplete. The goal is to make the omissions visible and assignable, not to finish the inventory in one pass. An examiner who sees a living inventory with owners and dates is likely to trust the rest of the program. An examiner who sees a pristine inventory created the week before the request is likely to dig deeper.
Where this fits in the larger exam
Exhibit A is the first exhibit because every other answer depends on it. Exhibit B tests whether your governance covers the systems you listed. Exhibit C asks for details on the high-risk systems you flagged. Exhibit D traces the data behind those systems. If the inventory is wrong, the later exhibits become a series of corrections rather than a demonstration of control.
Footnotes
-
NAIC, “AI Systems Evaluation Tool 4.0,” 2026: https://content.naic.org/sites/default/files/inline-files/AI%20Systems%20Evaluation%20Tool%204.0%20%28Clean%29.pdf ↩ ↩2 ↩3
-
NAIC, “Use of Artificial Intelligence Systems by Insurers,” Model Bulletin adopted December 4, 2023: https://content.naic.org/sites/default/files/inline-files/2023-12-4%20Model%20Bulletin_Adopted_0.pdf ↩ ↩2
The Bottom Line
- Exhibit A is the base every other exhibit stands on. If the inventory is incomplete, the exam stalls before it starts.
- A good inventory is organized by business line and operational area, not by model or vendor. Regulators ask where AI touches decisions, not where the code lives.
- Direct consumer impact and material financial impact are the two fields that decide how much downstream documentation you need.
- Shadow AI and vendor-operated systems are the most common omissions. If a business line uses AI but does not own it, it still belongs in the inventory.
- The goal is not a perfect taxonomy. It is an honest list with owners, dates, and consequences that you can produce on demand.

Simon Li · Founding Editor
Simon Li is the founding editor of InsureAI Wire, an independent publication tracking how the NAIC and individual states regulate AI in insurance — and translating it into what compliance teams must actually do. Every figure is traced back to a primary NAIC or state source.
Free · Weekly
Track these developments weekly
Get the InsureAI Wire dispatch in your inbox. Free, sourced, no spam.
Free weekly · No spam · Unsubscribe anytime
Related reading
AI in Health Insurance Claims, Prior Authorization, and Risk Adjustment
How health insurers use AI in prior authorization, claims adjudication, and risk adjustment. What the NAIC, CMS, and recent litigation mean for governance.

AI in Homeowners Insurance Pricing and the State Rate Review
How homeowners insurers use AI, aerial imagery, and catastrophe models to price property risk, and what state regulators now require for transparency.

AI in Life Insurance Underwriting and the New Regulatory Test
How life insurers use AI in accelerated underwriting and what regulators now require for proxy testing, fairness, and documentation.

AI in Reinsurance Treaty Pricing and Catastrophe Modeling
How reinsurers use AI in treaty pricing, catastrophe modeling, and contract analysis. What model transparency and capital governance mean for risk carriers.
Information aggregation and analysis, not legal advice. See our disclaimer.